
Reporting is a critical component of commission software. Here at Sales Cookie, we provide many commission reports out of the box:
- Crediting reports (ex: which territory closed the most deals?)
- Attainment reports (ex: which reps met their quota?)
- Payout reports (ex: how much did AEs earn last month?)
- Revenue analytics (ex: what is my customer churn rate?)
- Survey analytics (ex: how do reps rate their commission accuracy?)
- Amortization reports (ex: how can I comply with ASC 606?)
- Manager dashboards (ex: how did my team perform last month?)
This said, we also realize it’s impossible to provide the exact report you had in mind because you’ll want specific groupings, labels, filters, visualizations, colors, etc. This is why Sales Cookie integrates with award-winning solutions such as Microsoft Power BI and Tableau Software. Let’s see how easy it is to visualize sales commissions using Tableau!
Connecting To Sales Cookie
First, login to your Sales Cookie account and copy your API URL (under profile settings). Your API URL includes a key embedded within it, so you never need to provide a user name / password to connect from Tableau to Sales Cookie’s cloud solution.
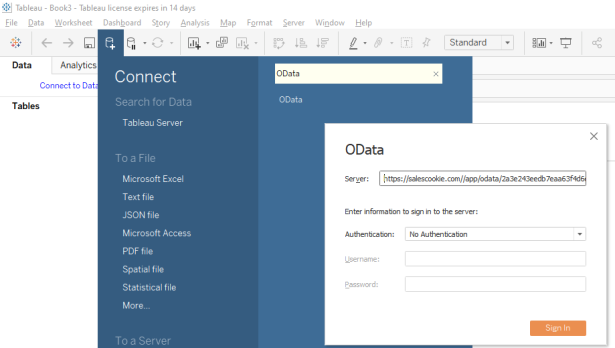
Next, start Tableau and add an OData connection. Simply copy your API URL and choose No Authentication. The key within your API URL authenticates you. Do not share your API URL with anyone! Your commission data is encrypted at rest and over the wire.
Choosing Entities
Tableau now shows a list of entities you can use to build commission reports. Simply drag them to the right pane. You can also drag them onto other entities to indicate that they are related.

Tableau will ask you to describe each relationship. Microsoft Power BI automatically detects relationships. With Tableau, you have to do this manually, but it’s very easy. Below, we linked Calculations with Calculation Results. Calculation Results specify aggregate commission payout information (per calculation and per payee).
For Calculations, we selected field “Id”. For Calculation Results, we selected field “Calculation Id”. Each Calculation Result’s “Calculation Id” field points to a Calculation by its “Id”.

We can further help Tableau and specify that the relationship is one to many. Each Calculation has a unique Id. However, multiple Calculation Results may point to the same Calculation. This step is optional but can reduce the number of queries made by Tableau.

Building A Report
Next, let’s build a simple report. We’ll drag the Calculation’s “Name” field to rows, and show a sum of Calculation Result “Value” fields (value = payout). We now have the total payout per calculation as a table:

Of course, we can change the display to something more exciting like this. This just takes one click. We could also have chosen pie chart, bar chart, etc.

Adding More Entities
Next, let’s add more entities are connect them. First, let’s add the Plan entity. Each Calculation references a single Plan. We’ll also add Transactions, Calculation Commissions (which are per-transaction payouts), Calculation Credits (records assignment of transactions to reps / teams), and System Users (representing payees).

A lot more information is now available to Tableau! We can now create more interesting reports such as this one. Can you commission software do this? Sales Cookie can!

In Conclusion
Many commission software solutions offer very limited reporting capabilities. Sales Cookie offers many reports out of the box, but also lets you analyze your commissions using powerful BI analytics tools such as Tableau or Microsoft Power BI. Visit us online to learn more!
